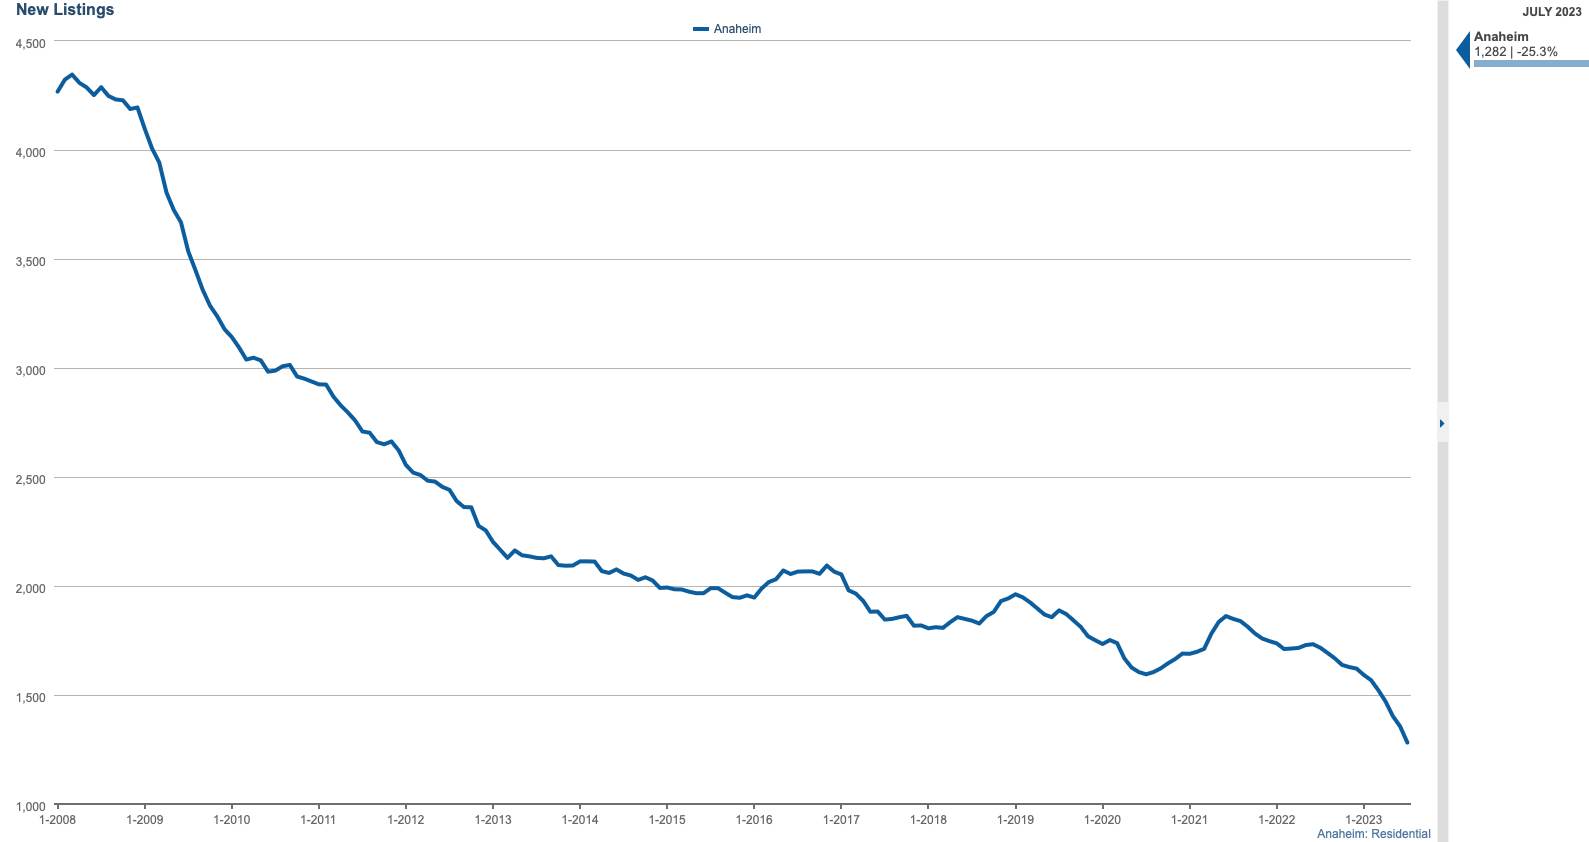
“New listings” is the number of listings entered on the market for sale during a given period. If I were to plot what they are each month, it really wouldn’t represent how few sellers are deciding to move forward with a sale. However, when I use “12 month rolling average”, the severity of the change is finally revealed.
You can see from the graph that it’s at an all-time low when using historical data for the City of Anaheim that my software allows me to graph. When I use the entire SoCal CRMLS data, it’s still the lowest point but the 2013 mark is pretty close when we were climbing out of a foreclosure bust.
I don’t recall any Real Estate expert (or even amateur blogger) predicting this would happen.
While some predicted a crash where prices would be spiraling down, NOBODY predicted a “tumbleweed” market, where not only is demand down, but supply would be way down creating a climate for very little transactions where the buyers still outnumber the few sellers resulting in multiple offers and quick sales.
Why did the higher rate result in lower supply?
First, we have to remember the motives of people decide to sell. A good amount of sellers need a replacement property. Let’s categorize them:
- Someone who wants to sell and then rent. For this group, they’re seeing sticker shock for the monthly rents in the areas they consider. The ones who put the brakes on this idea are the ones who are currently paying $3,500 a month from their low interest rate only to see that $3,500 a month will only get them a 2 bedroom apartment.
- Someone who wants to sell in order to buy. While most “move up” sellers know that they will be moving up in their monthly mortgage amount, they’re seeing a considerable jump when going out of their 3% interest rate to getting pre-approved with their 7% rate. Even when using a considerable amount of their existing equity, the higher loan amount on the “upleg” home combined with the higher interest rate is often a non starter.
- Someone who wants to trade into another investment property. Similar to scenario #2, the investor runs their numbers and is now seeing negative cash flow — even if they were moving laterally in price.
Who’s left to sell in this market?
4. The seller who already has place to live. This is sometimes the children who inherited their parent’s property or the person who owns multiple properties and doesn’t need a replacement.
5. The seller who has a very small loan on their existing home or no loan at all and the replacement home can be purchased cash.
6. A distressed seller. This is someone who NEEDS to sell: divorce, foreclosure, bankruptcy, etc
There are some other categories as well, but as you can imagine, the majority of sellers are in categories 1-3.

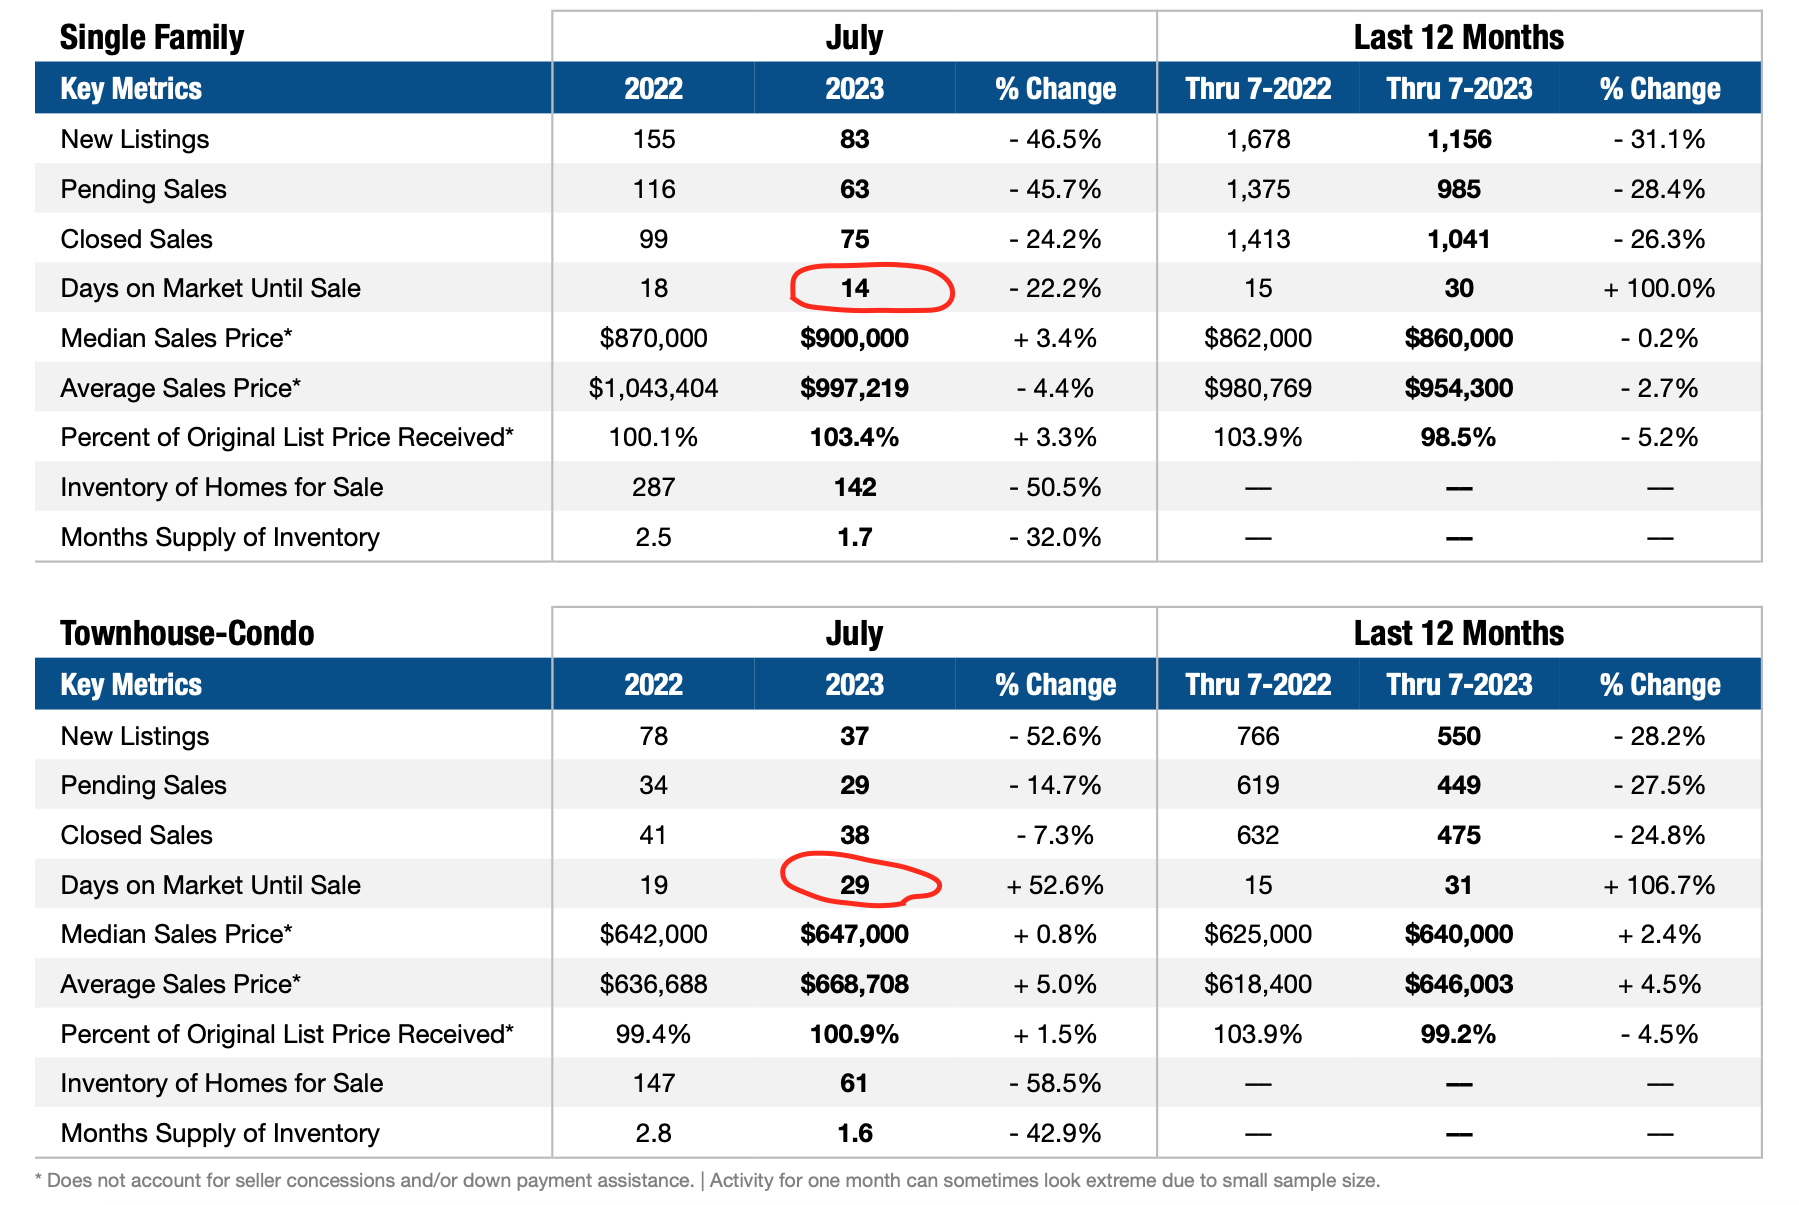
In the table above, while it shows the amount of new listings plummeting, 2 metrics to pay attention to are 1) “Months of Supply” and 2) Days on Market Until Sale.
Months of supply is a metric widely use to determine if it’s a buyer’s or seller’s market. 1.6 months is lower than last year at this same time and will likely stay there until interest rates get lower for the townhouse and condo market in Anaheim.
Sorry we are experiencing system issues. Please try again.

