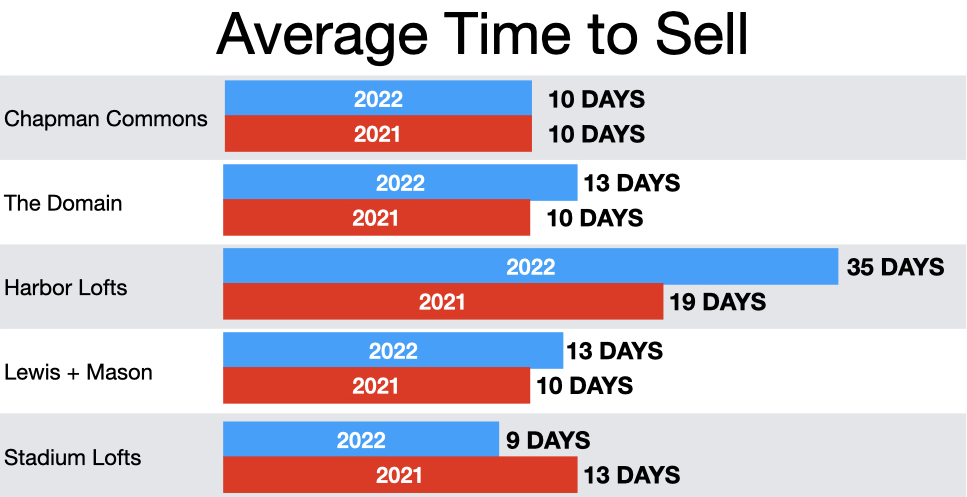
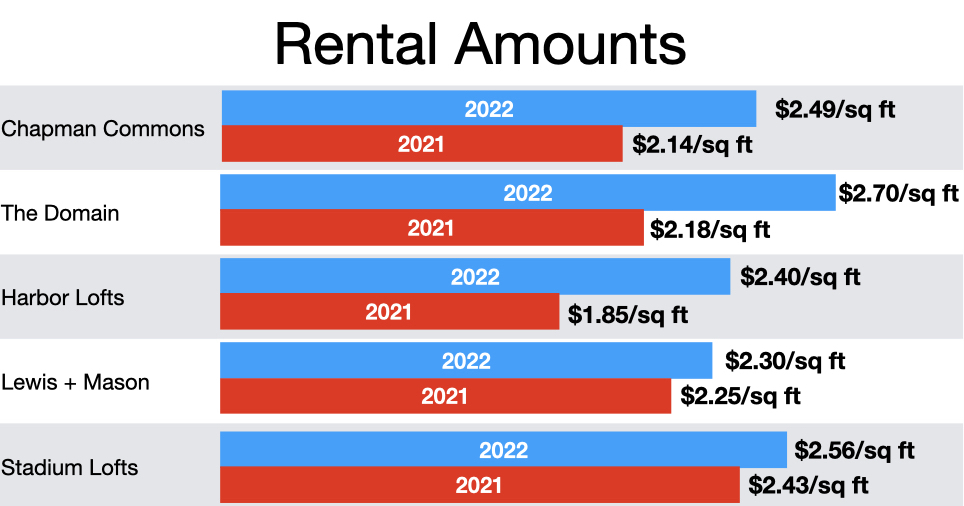
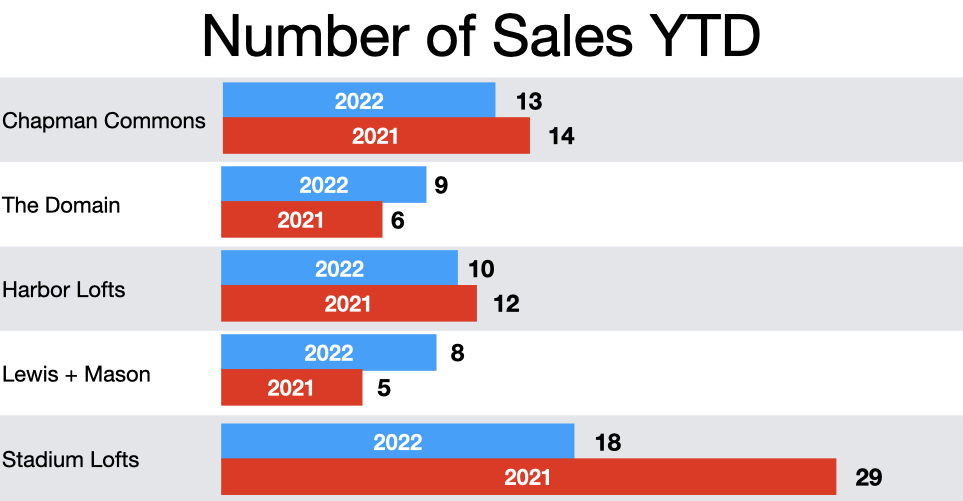
In 2018, Real Estate supply peaked in Anaheim at over 20 months of supply. Watch my video to see where we are today for the Chapman Commons, Harbor Lofts, The Domain, Lewis and Mason, and Stadium Lofts. I highlight the effect of interest rates, the inventory comparison vs. the 2008 crash, new construction in the area, rental values, and other key metrics for your building.


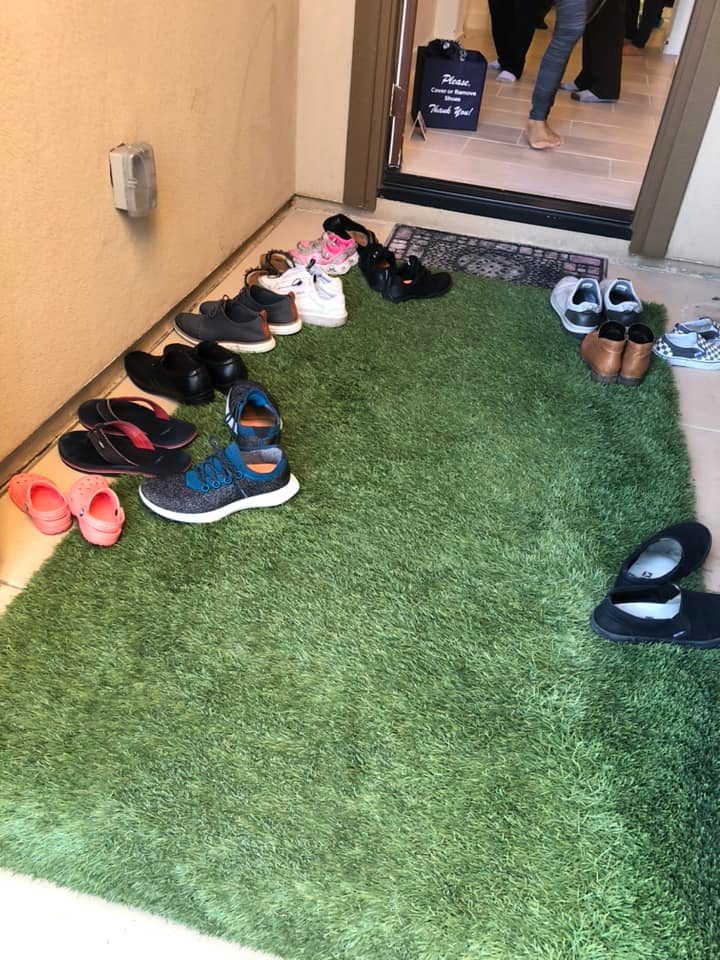
While the graphs shown above show a very optimistic outlook for sellers, the smaller details are much more drastic when comparing the market to February. During those months when rates were around 3%, it was common to have every showing slot taken and long lines to enter open houses. Today, a busy day might be 2-3 showings. Far less, but any showing is better than zero showings.

Sorry we are experiencing system issues. Please try again.

